The hockey stick climate change graph
In a review in Prospect, Matt Ridley, who is no slouch as a science writer himself, calls Andrew Montford’s The Hockey Stick Illusion “one of the best science books in years”. Pretty high praise for what Ridley also calls “the biography of a graph”. Specifically, this graph:
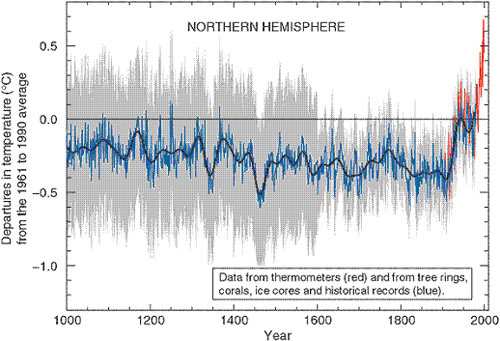
You may have seen it in An Inconvenient Truth in this form. The graph shows the dramatic rise in temperature in the northern hemisphere over the past 100 years caused, presumably, by humans. But as Montford details in his book, the graph is incorrect.
[The author] had standardised the data by “short-centering” them — essentially subtracting them from a 20th century average rather than an average of the whole period. This meant that the principal component analysis “mined” the data for anything with a 20th century uptick, and gave it vastly more weight than data indicating, say, a medieval warm spell.
Talk about an inconvenient truth.
Update: As expected, ye olde inbox is humming on this one. Here are a few places to look for the other other side of the story: Real Climate, Climate Progress (2, 3), New Scientist, and RealClimate. (thx, reed, barath, aaron)
Socials & More