A Hand-Drawn Visualization of the US Economy from 1861 to 1935
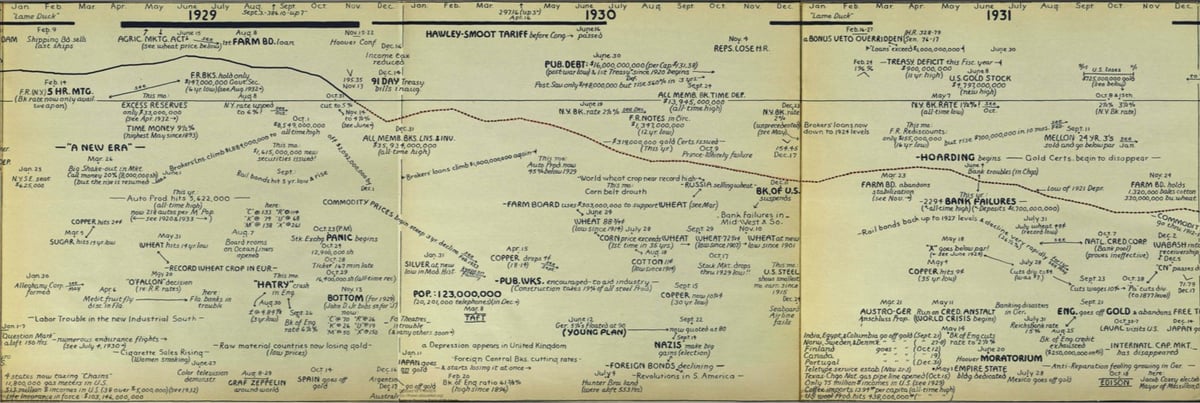
In 1936, former director of research at the Cleveland Federal Reserve L. Merle Hostetler published 75 Yrs. of American Finance, a hand-drawn chart of the economic health of the US from 1861 to 1935. The chart, which is horizontally oriented, shows a trending business activity index (which measures productivity) along with other financial data, indicates when Congress is in session, lists notable news events, and shows the high and low of the DJIA (starting in 1898). The graphic at the top shows Hostetler’s chart from 1929-1931, aka the beginning of the Great Depression.
The copy of this chart hosted by the St. Louis Fed goes to 1938…it must have been updated at some point. Also, if you go into the “»” menu in the upper-right corner of the in-page document viewer, you can set it to “horizontal scrolling” for easier viewing. (thx, andy)
Update: Philip Bump made a horizontally scrolling B&W version of Hostetler’s chart. This is a lot easier to navigate than St. Louis Fed version.
Stay Connected