Flowing Data’s Best Data Visualizations of 2019
Nathan Yau of Flowing Data picked his ten favorite data visualization projects for 2019. All the projects listed are worth a look … but maybe, just maybe, this post is really just an excuse to let my eyes feast upon Scott Reinhard’s historic topographic maps once again.
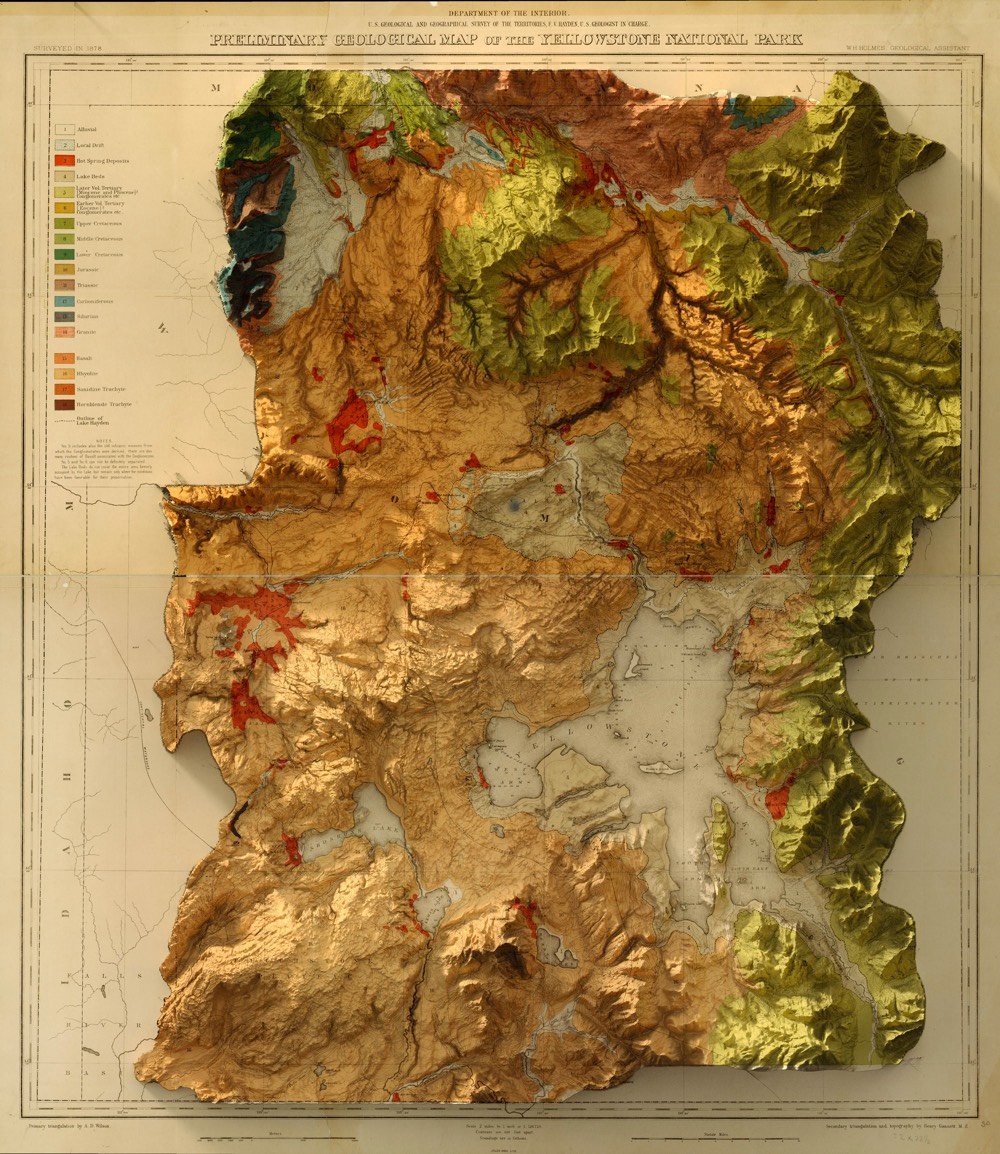
Designer Scott Reinhard takes old geological survey maps and combines them with elevation data to produce these wonderful hybrid topographic maps. From top to bottom, here are Reinhard’s 3D versions of a 1878 USGS Yellowstone map, a 1904 USGS map of Acadia National Park, and a 1899 USGS map of the Grand Tetons.
Stay Connected